

(Map of proposed rezoning in Bella Vista. Image: Philadelphia City Planning Commission)
Jake Blumgart reports that five years after Philadelphia passed a landmark zoning reform bill, only about half of the city has been remapped, and some zoning watchers say City Council foot-dragging is part of the reason.
The way it works is that the Planning Commission first does a district plan, which covers many different neighborhoods in a region, and then once that's adopted, they go back with a fine-tooth comb and remap individual parcels at the neighborhood level.
Planning is nearly done with all the district plans, and they're producing remapping proposals at a good clip. But (some) City Councilmembers are just sitting on these proposals and not doing anything with them.
“In 2013, we started a comprehensive look at remapping Philadelphia,” said Andrew Meloney, a senior planner for the city, in his presentation to the Planning Commission. “In 2013, we had three plans adopted. Now we have 15 adopted, so the basis for remapping is growing all the time.”
With only three district plans left to be completed, and the entire process likely to be finished by next spring, Meloney reported that 39 percent of the 12,369 acres of proposed remapping have been completed. In the last fiscal year alone, 1,869 acres were remapped, the most accomplished in a single year since 2013 [...]"
But these neighborhoods are still the exception. The Planning Commission is purely advisory and the remapping suggestions actually have to be enacted by City Council, which defers to the district councilmembers representing the area. Meloney showed the commission that of the 12,369 acres that have been subject to remapping proposals over half—6,966 acres—have yet to be acted upon. Only 629 acres are currently in the process of being remapped."
Some Councilmembers may not be cooperating because they prefer outdated maps, on the theory that outdated maps generate more variances, and provide more veto points for District Councilmembers to play deal-maker.
But it's not always the case that the new maps are better than the old maps, which highlights a problem with the Planning Commission's practice of using 'acres remapped' as a metric to chart their progress on zoning reform.
For example, the new maps in Francisville and Mantua reduced those neighborhoods' capacity to absorb more residents, in spite of expectations that they'll soon be seeing more demand. Lots of residents thought that was a good thing, because they wanted to keep out student housing, but there are also good arguments against downzoning growing neighborhoods from the perspective of maintaining affordability.
Just knowing that a certain number of acres have been rezoned citywide, or within neighborhoods, doesn't give us much useful information about the content of those rezonings, or how they impact the city's ability to grow.
Going forward, the Planning Commission should include a 'nutrition label' for all zoning remapping bills to better inform the public about what they would do.
Every remapping bill should come with a before-and-after table showing the change in 'maximum residency' (the highest possible number of people who can live somewhere under current zoning) for the area being remapped, with a few plain English sentences summarizing the general thrust of the changes being made.
Planning also provides color-coded maps to RCOs in advance of starting the remapping conversation, but you typically have to email to ask for them. Those should be on Planning's website, and included in the PDFs for remapping bills on Legistar. Currently, Council will only put some very hard-to-compare black and white maps on Legistar, unduly limiting the number of people doing outside analysis of the bills. It's not clear why use of the black and white maps persists, when the color-coded ones are easier for everyone to understand.
If the Planning Commission were to standardize the process of measuring changes in maximum residency for each zoning bill, it would also be easier to check in regularly on how Council is changing the maximum residency for the whole city.
Evan Sultanik did a first-pass analysis of the remapping changes since zoning reform passed in 2012, and found that the city as a whole increased its residential capacity by about 7%. In 2012, Philly had zoned capacity for about 5,229,657 people, and the sum total of remapping changes increased that to a maximum of about 5,615,158 in 2017. At the current rate of population growth, Philly wouldn't hit the maximum residency limit until the year 2337.
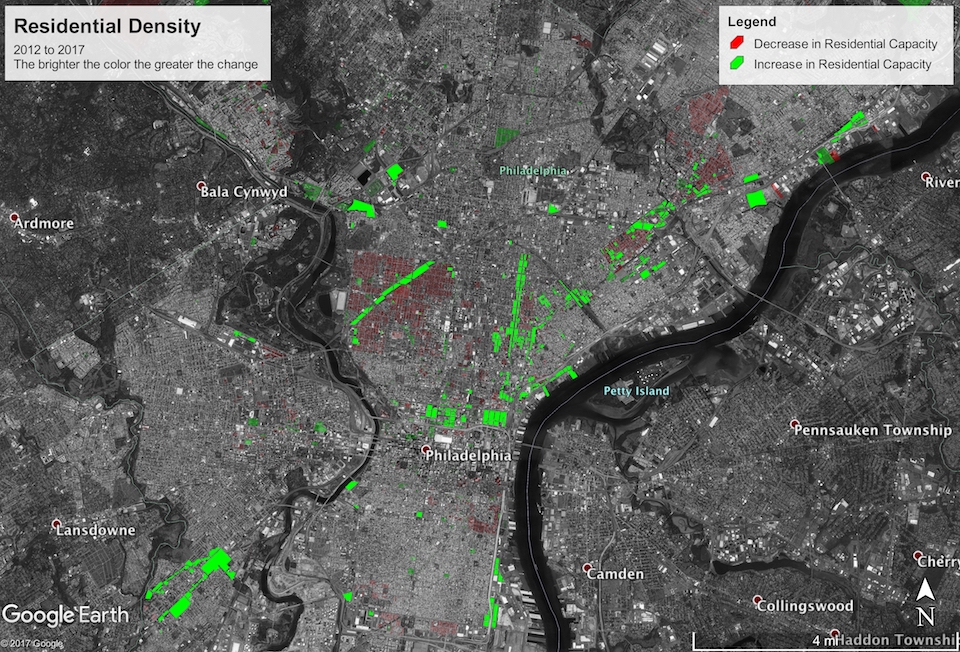
Population growth isn't spread evenly though, and it's unclear how much of a relationship exists between the places where Council has been increasing 'maximum residency' and the neighborhoods where people have been voting for with their feet since 2012. A lot of that extra capacity is coming from conversions of industrial zoning to residential, but in places like the northern end of North American Street, and the far Southwest and Southeast that aren't seeing a ton of housing demand. Meanwhile, areas like Queen Village, where housing prices have been steeply climbing, reduced their capacity to absorb more residents.
If Planning created a nutrition label for each remapping bill, residents of Queen Village would at least be able to see in advance that they would be downzoning the neighborhood, and could have a proper debate about that.
But without being able to compare the changes in maximum residency, people are flying blind as to the cumulative effect of the changes both at the neighborhood level, and at the citywide level. The imperative to start paying attention to zoned capacity in growing areas is only increasing, as Philly is hitting record low inventory levels, and home prices are increasing in every sub-market.
Stay tuned: we're exploring some other ways to analyze the impact of the remapping changes. For the data analysts who may want to explore this further, you can download the KML file that Sultanik created for the map above.
To stay in the loop on political news, events, and updates from Philadelphia 3.0, sign up for our email newsletter and follow us on Facebook and Twitter.
Be the first to comment
Sign in with
Facebook